William's blog
Spectrogram peak detection with scipy

A spectrogram is a visual representation of the spectral content of a signal, typically represented as a graph of time versus frequency. It is commonly used in signal processing, acoustics, and speech analysis to highlight patterns and structures in a sound wave. Peak detection involves identifying the points of maximum amplitude in a signal or spectrum.
Statistical arbitrage in the high-frequency domain
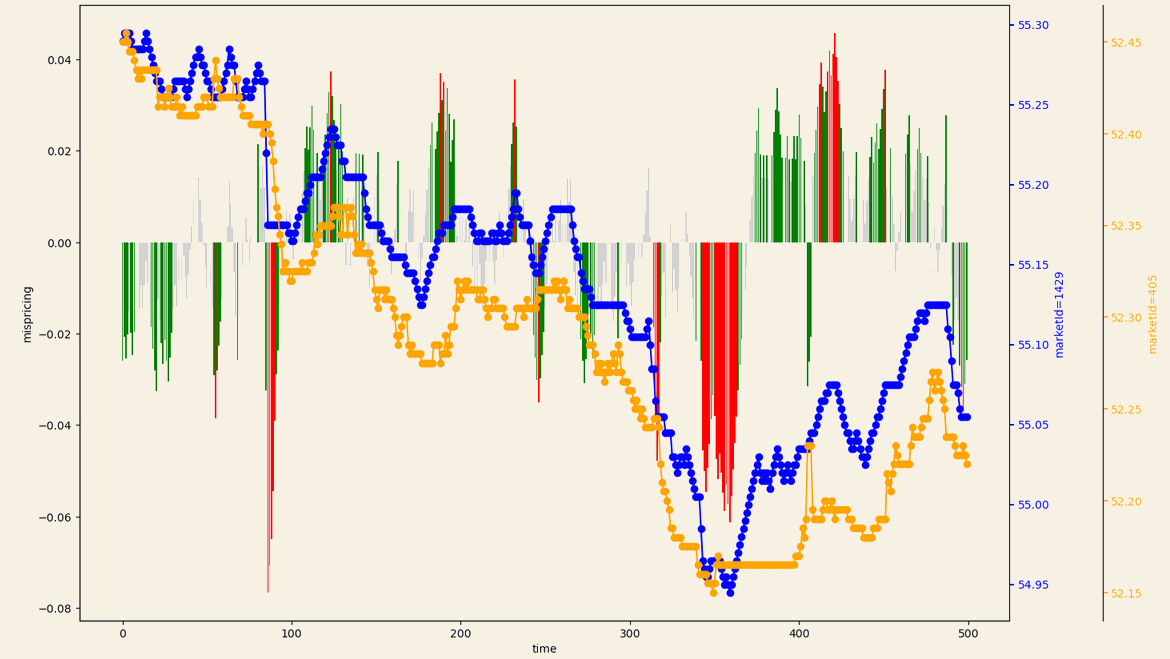
Quantitative traders adopt a statistical and machine learning approach known as statistical arbitrage to identify relative mispricings. This market-neutral strategy is executed by an automated trade execution engine based on simple logic. In the high-frequency domain, computer programs monitor and analyse multiple market order books in real-time.
Copula models in Python using sympy
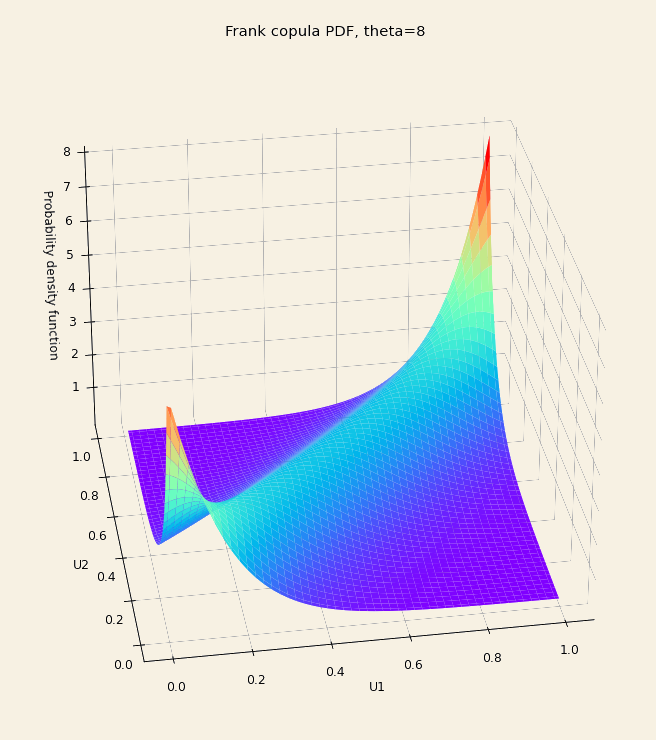
A copula is a cumulative distribution function with uniform marginals. Copulas are a popular statistical tool in risk management because they provide a method for capturing and characterising co-dependency between arbitrary random variables. Copula allow marginal distributions to be estimated independently, with dependency defined on-top of them.
Building a regex engine from first principles in Golang
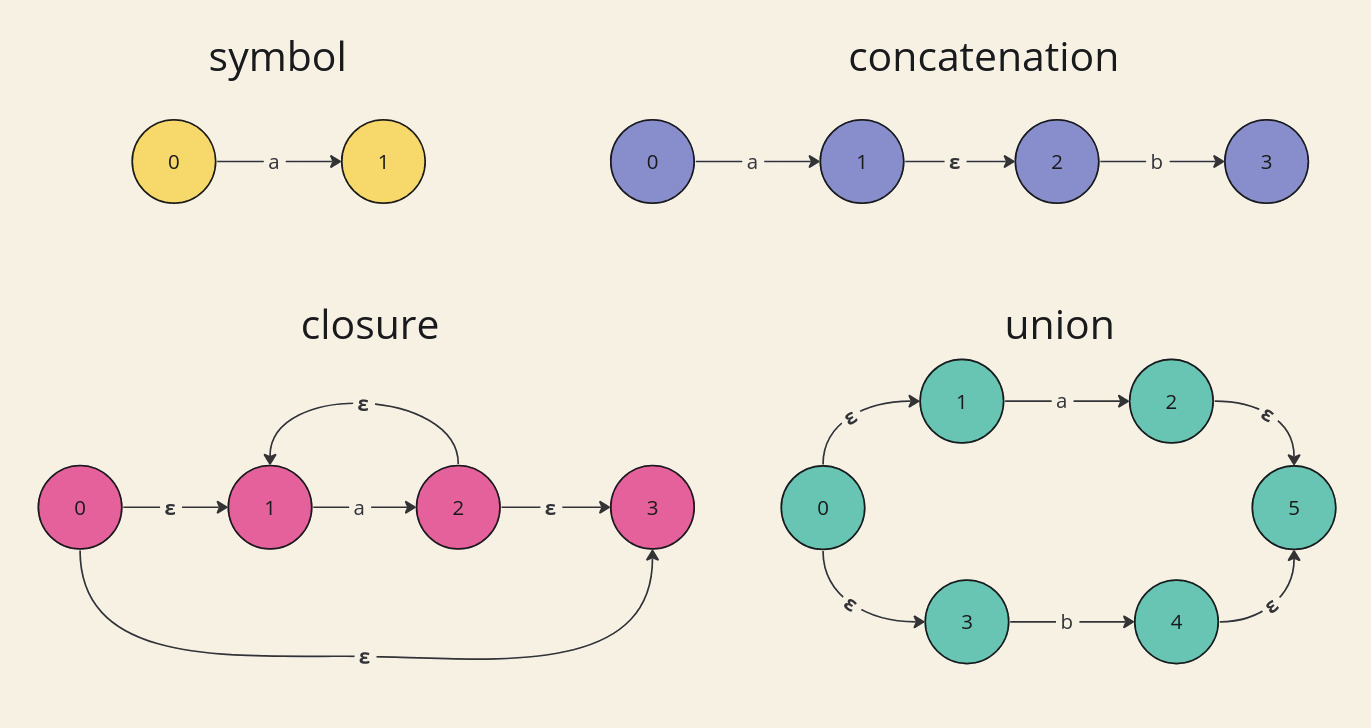
Regular grammars define regular languages. We can define recognisers for regular languages using simple finite state machines. Regular grammars are equivalent to regular expressions which are used throughout computer science to define basic string search patterns.
Algorithmic trading: triple barrier labelling
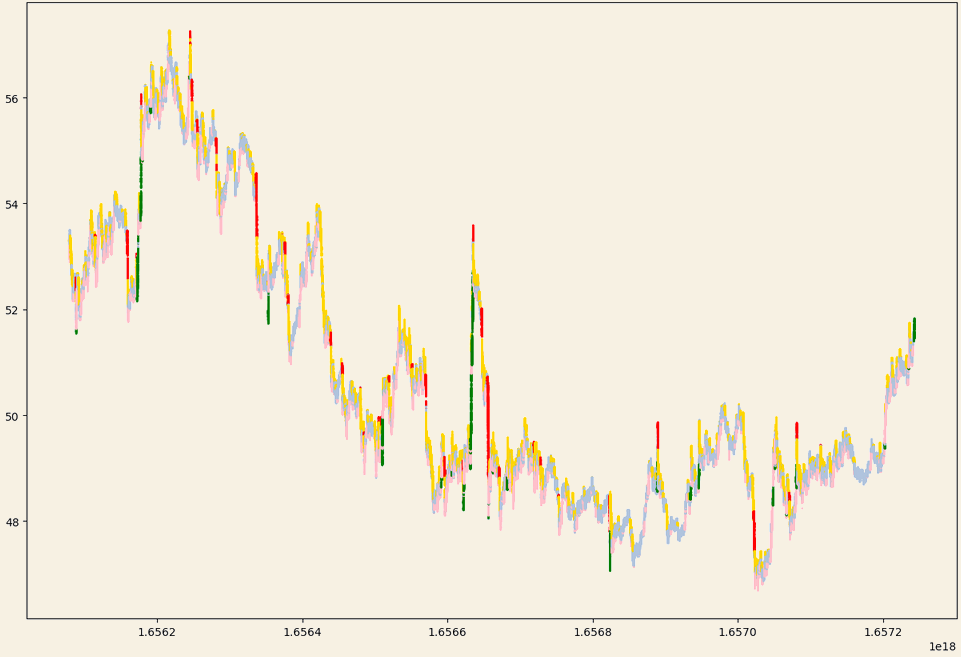
Triple barrier labelling is a technique for assigning labels to an otherwise unlabelled financial time series, according to some risk parameters. The algorithm sets three barriers: a profit-taking barrier, a stop loss barrier, and a maximum holding period, and labels the outcome of each trade based on which barrier is hit first.
Logistic regression from scratch in R
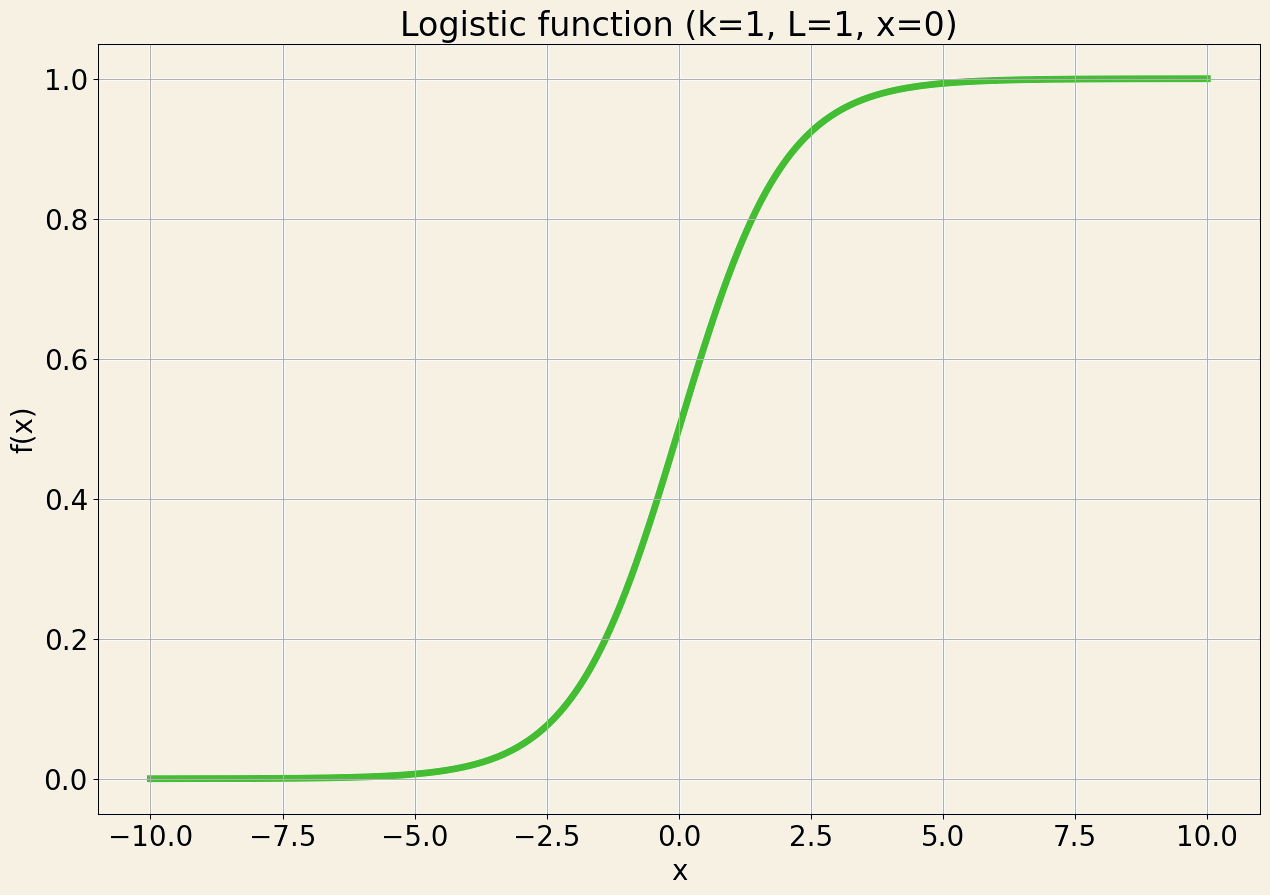
Logistic regression is a method for modelling the probability of an event happening via a linear combination of its independent variables. The logistic function converts the log-odds into a probability \(\in [0, 1]\). The log-odds is the logarithm of the odds ratio: the probability an event will occur divided by the probability it will not occur.